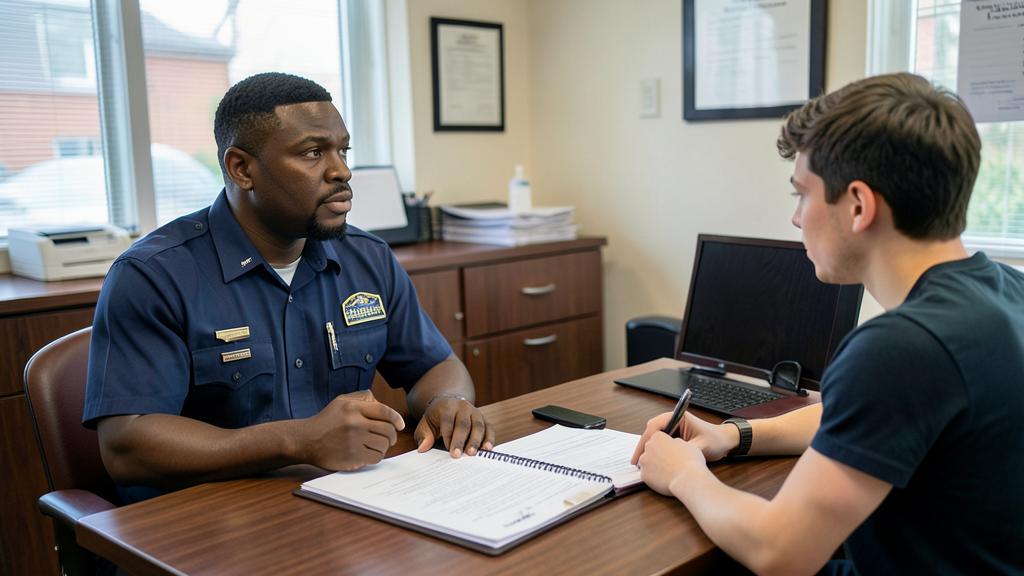
Probation & Parole Officer
Law & Public Safety
Supervise and support people reentering the community.
Why it matters here: Maryland DPSCS recruits officers for county offices.
Labor Market — DMV Region
Sourced from U.S. Bureau of Labor Statistics OEWS releases (DMV metro and nationwide) plus MD, VA, and D.C. workforce agencies.
Local cost of living is why DMV pay often differs from the national median.
- DMV & state figures: U.S. Bureau of Labor Statistics — OEWS wage & employment estimates and Employment Projections, with OEWS area pay relatives for the Washington–Arlington–Alexandria metro, Maryland, D.C., and Northern Virginia · View source
- Occupation profiles & skills: O*NET OnLine (U.S. Department of Labor) · onetonline.org
All salary figures are published estimates for groups of workers, not offers or guarantees for any individual role.
Education & Career Pathways
Multiple ways to get here — pick the one that fits your life.
Career Progression
How you can grow — with expected salary at each step.
- Entry-level Probation & Parole OfficerLearning the role, supervised work, building core skills.$51,230
- Probation & Parole Officer (experienced)Independent work, mentoring newer team members.$67,560
- Senior / Lead Probation & Parole OfficerOwning projects, specialization, higher responsibility.$92,650
- Manager or specialist trackSupervising a team or moving into a high-demand specialty.$111,180
Skills Required
What you'll actually do — and how you'll be judged.
Office meetings and field visits, weekday hours with evening checks
Where you work
A caseload office for scheduled check-ins, plus home, school and workplace visits in the community.
Hours and schedule
Weekday hours with some evening and early-morning field visits and rotating on-call.
Pace and pressure
Caseload-driven and paperwork-heavy, with court dates setting hard deadlines.
Who you work with
You work with courts, treatment providers, families and law enforcement.
Physical demands
Driving, walking into unfamiliar environments, occasional confrontation.
What people wear
Business casual; badge and sometimes protective vest for field work.
Remote reality
Mostly in person; some virtual check-ins.
Workplace culture: what's normal here
- The role balances support and accountability, and officers talk openly about that tension.
- Safety protocols mean some visits are done in pairs, never alone.
- Documentation of every contact protects both the officer and the person supervised.
Source: U.S. Bureau of Labor Statistics, Occupational Outlook Handbook — Work Environment, with regional detail for the DMV.
Official data behind this career
Federal statistics for DMV Region, translated into plain language.
Washington–Arlington–Alexandria, DC–VA–MD–WV metro area
Source: U.S. Census Bureau — ACS 2019–2023 5-year estimates (tables DP03, DP02, DP05)
- The DMV functions as one labor market: workers routinely cross state lines to get to work.
- The largest employment destinations are D.C., Fairfax County and Montgomery County.
Top places these workers go to work
Source: U.S. Bureau of Economic Analysis — BEA regional GDP and personal income, most recent published year
Private-sector payroll data from ADP. It is a supplemental near-real-time indicator and does not replace BLS government employment statistics.
Source: ADP National Employment Report — Most recent monthly ADP National Employment Report
- 1U.S. Bureau of Labor Statistics (OOH, OEWS, Employment Projections, CES) — Primary source for occupation wages, outlook, projected openings, education and training.
- 2U.S. Census Bureau — American Community Survey — Primary source for income, educational attainment, labor force and demographic context by place.
- 3Census LEHD (LODES / OnTheMap) — Primary source for where workers live versus where they work, and local workforce flows.
- 4U.S. Bureau of Economic Analysis — Primary source for regional GDP, industry contribution, compensation and personal income.
- 5ADP National Employment Report — Supplemental near-real-time private-sector employment and pay indicator. Not a replacement for BLS.
Figures describe groups of workers, not any one person. Where an official figure is not published for a category, this page says “Data unavailable for this category.” rather than estimating.
Related Careers
Explore similar occupations with overlapping skills.
Research law, draft documents, and keep cases organized.
Respond to emergencies, provide medical care, and protect the community.
Respond to calls, investigate, and work with the community.
Advise clients, argue cases, and navigate the legal system.